U.S. Energy Cost Heatmaps (2026)
State-by-state visualizations from the latest EIA and NREL data. Free to share, embed, or republish with a link back to wattprice.io. Generated monthly — data is current.
Residential electricity rates
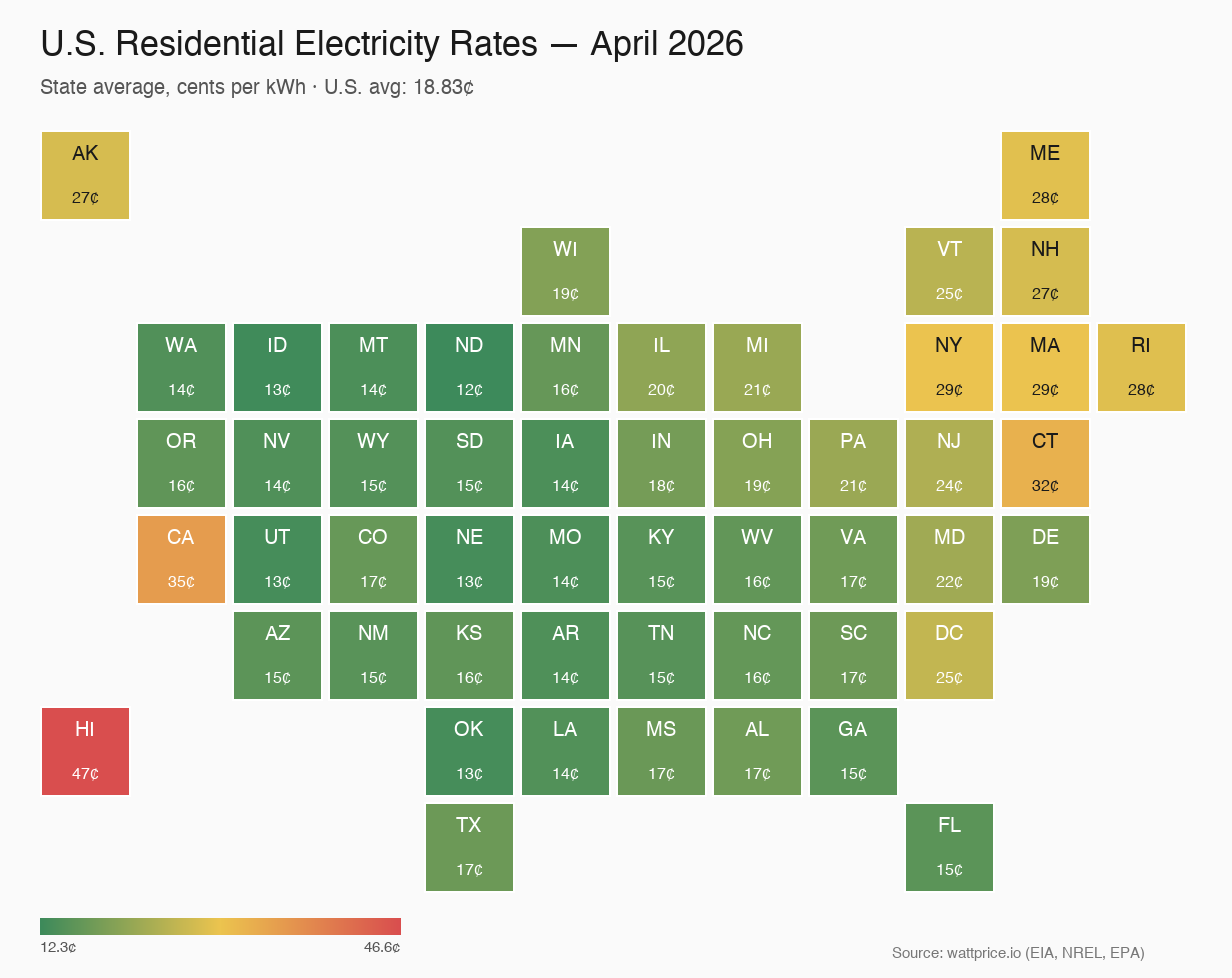
What it shows: State-average residential rate in cents per kWh, April 2026. U.S. avg: 18.83¢. Range: 12.4¢ (cheapest) to 46.6¢ (Hawaii). Full ranking.
Average household monthly bill

What it shows: 893 kWh/month (EIA national avg consumption) × state rate. Highest: Hawaii ${round(46.62*8.93)}/mo. Lowest: North Dakota ${round(12.35*8.93)}/mo. Per-state breakdown.
Tesla Model 3 home charging cost per mile
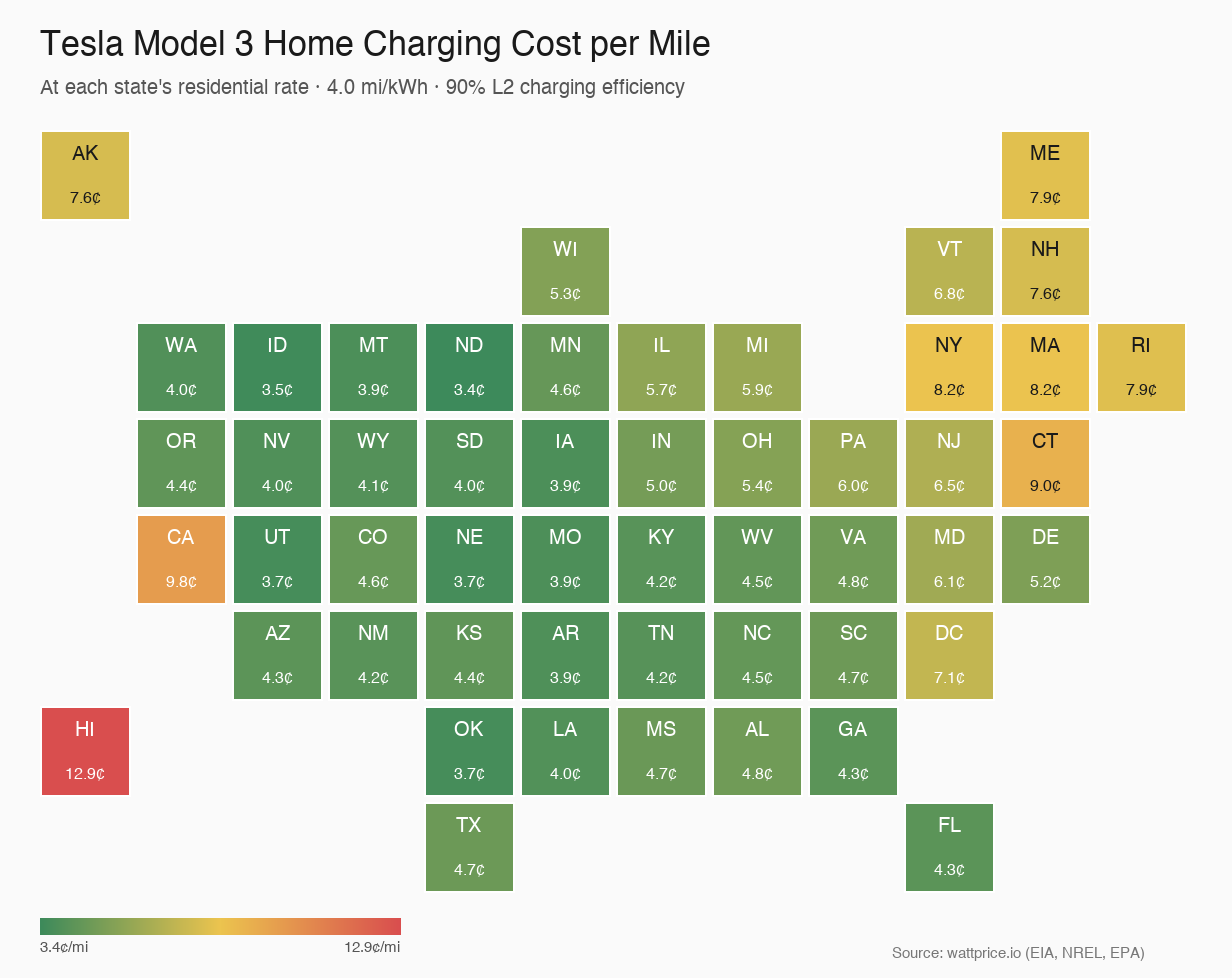
What it shows: Cost per mile to home-charge a Tesla Model 3 Long Range (4.0 mi/kWh EPA) at state rates. Range: 3.4¢/mi (Idaho) to 12.9¢/mi (Hawaii). For comparison: 30 MPG gas at $3.50/gal = 11.7¢/mi. Full ranking.
20-year net savings from rooftop solar
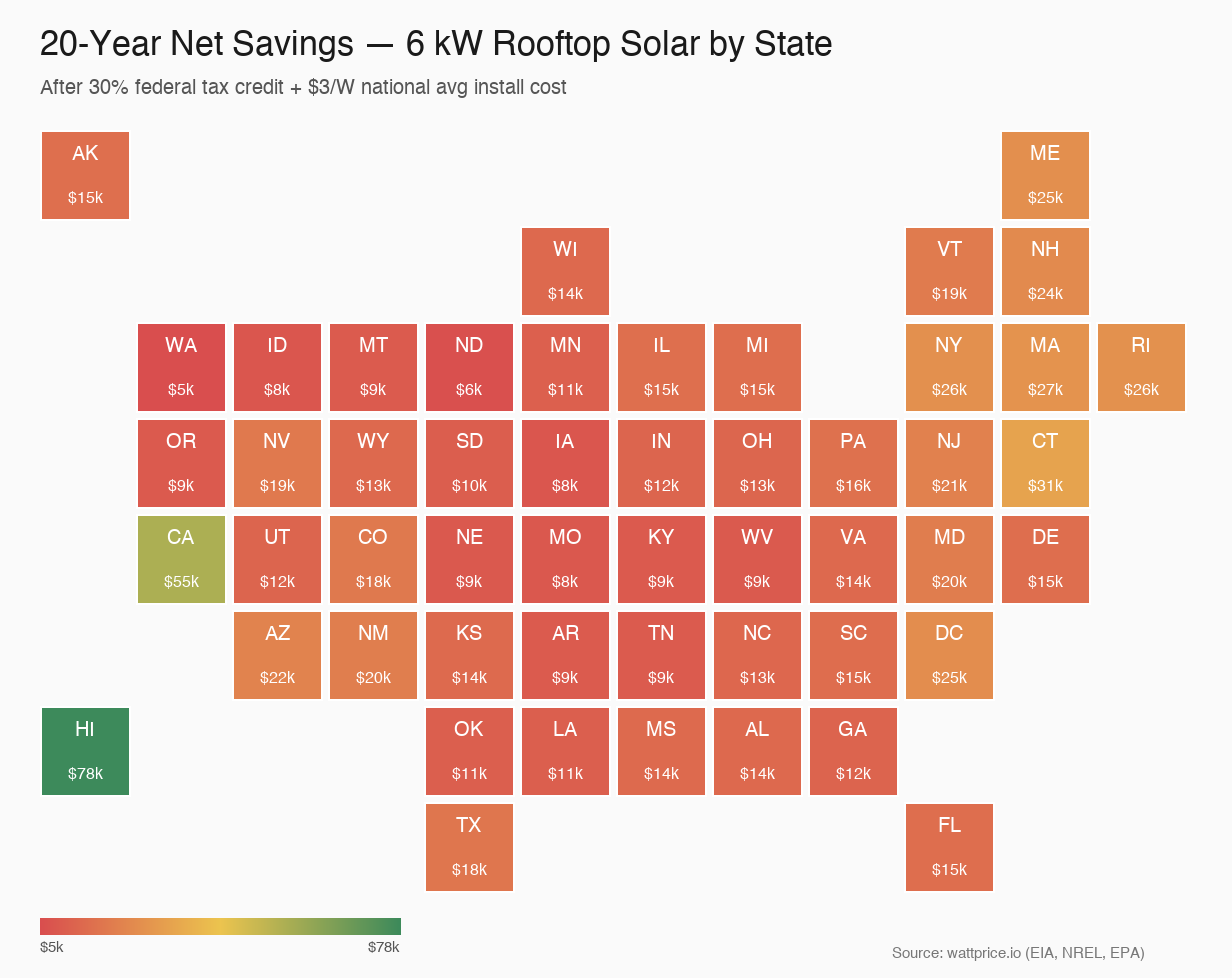
What it shows: 20-year net savings from a 6 kW rooftop system, after 30% federal Investment Tax Credit and $3/W national-avg installed cost. Sunny + expensive-electricity = big green (CA/HI). Cheap-electricity + cloudy = small or negative (Pacific NW). Full ranking.
Residential natural gas prices
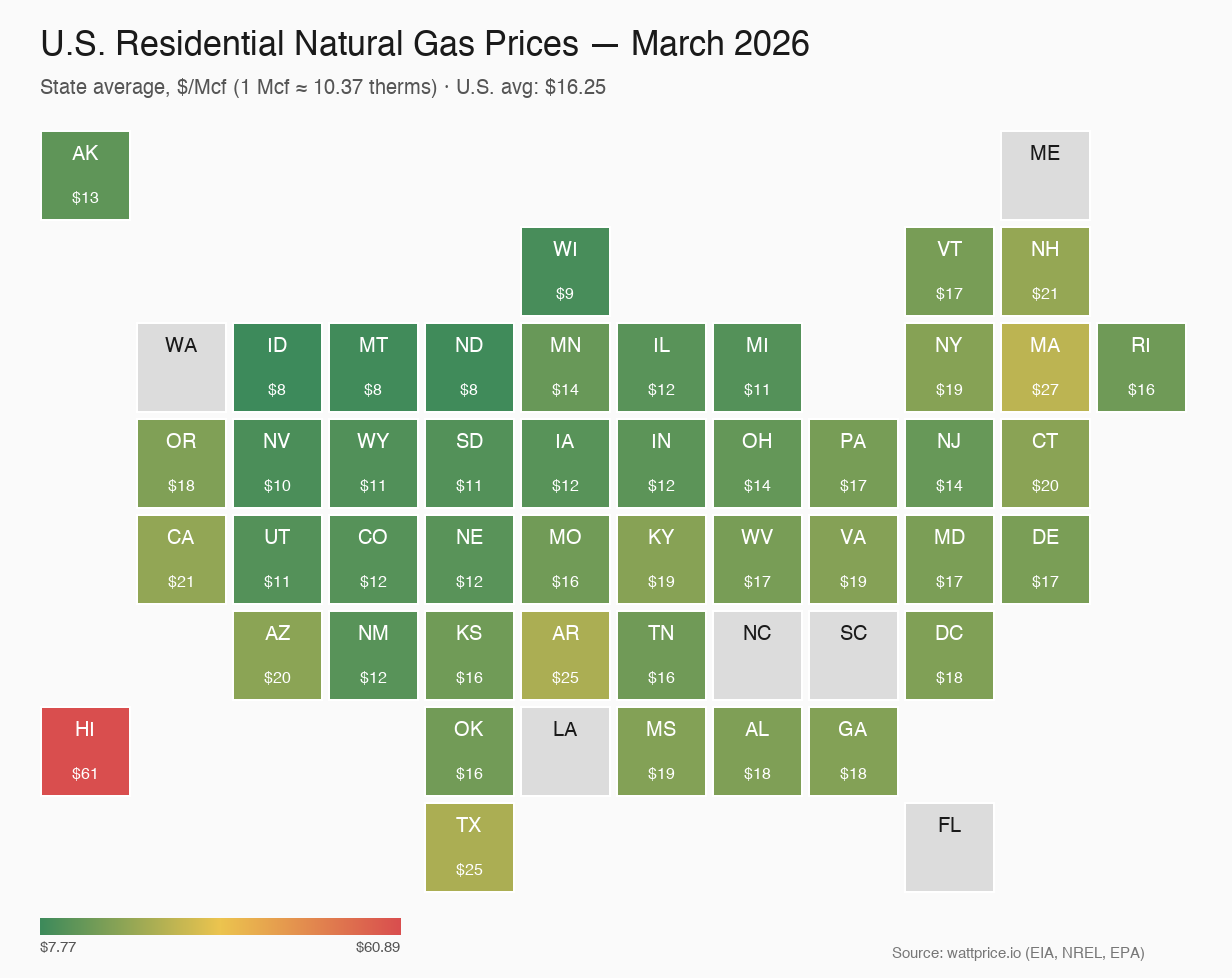
What it shows: State-average residential natural gas price in $/Mcf (1 Mcf ≈ 10.37 therms), March 2026. Drives the gas vs heat pump comparison for every state.
How to use these images
- Republish: Free to use on any blog, article, or social post. Attribution link (
https://wattprice.io/) is appreciated. - Embed: Link directly to the PNG:
https://wattprice.io/static/heatmaps/electricity_rates_2026.pngetc. - Cite: Underlying data is U.S. government public domain (EIA, NREL, EPA). No restrictions on the numbers themselves.
Data & method
Electricity rates: EIA Electric Power Monthly Table 5.6.A. Natural gas: EIA Natural Gas Monthly. Solar resource: NREL PVWatts. EV efficiency: EPA fueleconomy.gov. Heatmaps refresh monthly with each new EIA release. Full methodology.